

Imagine you are standing in a small pond. A tiny fish jumps, and the ripples are barely noticeable. Now imagine a massive shark diving into that same pond. The water splashes everywhere, and every other creature reacts instantly. In the cryptocurrency world, Crypto Whales are those sharks. When they move large amounts of Bitcoin or Ethereum to or from exchanges, the market doesn't just ripple; it crashes or surges. Understanding these movements is not about guessing-it is about reading the most transparent ledger in history.
We often hear rumors about who is buying or selling. But on the blockchain, there are no secrets. Every transaction is public. The key is knowing what to look for. Are whales moving coins to sell them? Or are they pulling them out to hold long-term? This guide breaks down exactly how to track these moves, what the data actually means, and why your portfolio might be at risk when big players shift their positions.
Who Exactly Is a Crypto Whale?
The term "whale" gets thrown around loosely, but in serious market analysis, it has specific definitions. A whale is not just someone with $10,000 in crypto. We are talking about entities holding enough capital to move prices simply by executing a single trade.
| Asset | Minimum Holding (Whale Status) | Estimated Value (Approx.) |
|---|---|---|
| Bitcoin (BTC) | 1,000+ BTC | $68 million+ |
| Ethereum (ETH) | 10,000+ ETH | $28 million+ |
These numbers come from industry standards set by analytics firms like Glassnode. Glassnode tracks these holdings using metrics like the "Whale Size Subdivisions." According to a 2023 study by 99Bitcoins, the top 100 wallets alone control roughly 15% of all existing Bitcoin. That concentration of power means their actions dictate liquidity. If those wallets decide to sell, there may not be enough buyers to absorb the shock without crashing the price.
Deposits vs. Withdrawals: Reading the Intent
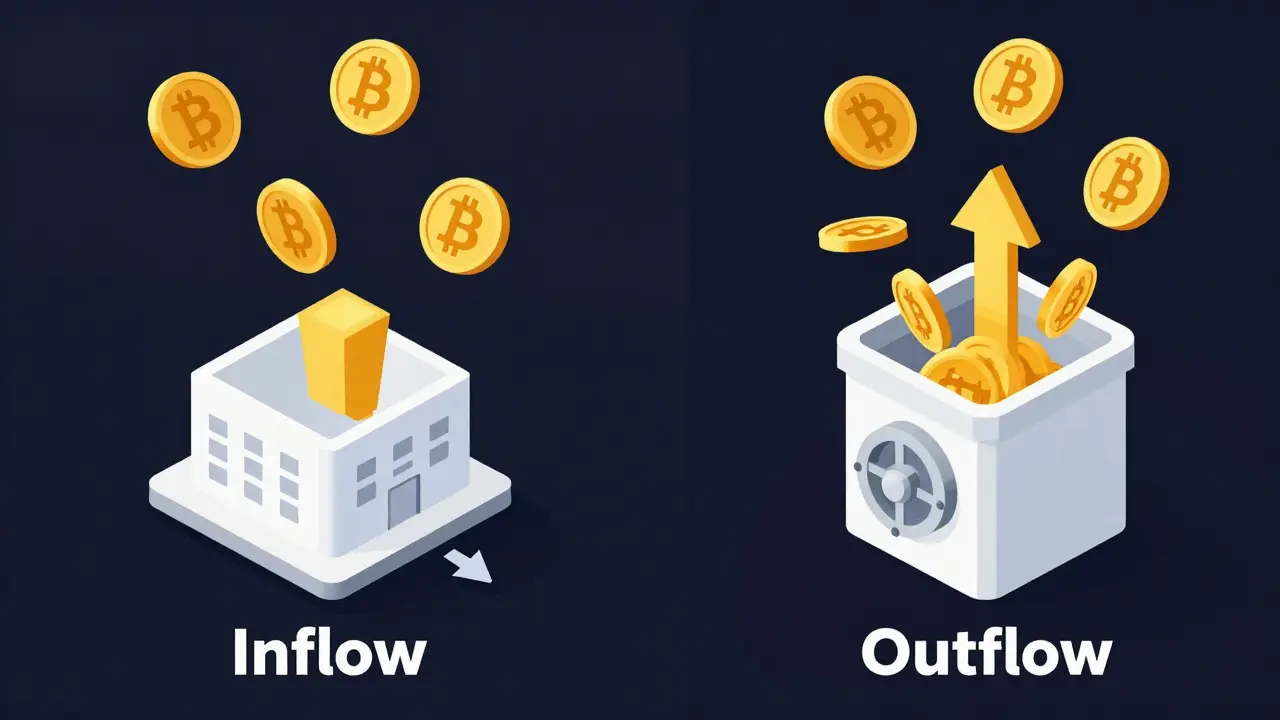
The core of whale tracking is simple arithmetic: Inflow minus Outflow. But the interpretation is where most traders get it wrong. You cannot look at a deposit and assume a sale, nor can you look at a withdrawal and assume a buy. Context is everything.
When whales deposit funds onto centralized exchanges like Binance or Coinbase, they are placing their assets within reach of the order book. Historically, this signals an intent to sell. Why would you move cold storage coins to a hot wallet connected to a trading platform unless you wanted to trade? However, as we saw in late 2023, the ratio flipped dramatically. Glassnode reported a Whale Deposit/Withdrawal Volume Ratio where deposits hit 100.61% while withdrawals were only 16.5%. Counterintuitively, this didn't crash the market immediately because many institutions were preparing for ETF approvals, not dumping bags.
Conversely, withdrawals usually signal accumulation. When a whale pulls 5,000 BTC off an exchange, they are removing supply from the market. This creates scarcity. OneSafe.io notes that withdrawals often lead to price stabilization or rises because selling pressure drops. But beware: sometimes withdrawals go to other exchanges for better fees, or to decentralized finance (DeFi) protocols for yield farming. It is not always a "hold forever" signal.
Key Metrics for Tracking Whale Activity
You do not need to manually scan the blockchain all day. Analytics platforms provide specific metrics that aggregate this noise into clear signals. Here are the three most critical ones you should watch:
- Exchange Inflow Mean: This tracks the average size of deposits. If the typical deposit size jumps from 0.7 BTC to 6.8 BTC overnight, it indicates coordinated movement. Large, sudden inflows often precede selling pressure.
- Bitcoin Accumulation Trend Score: Developed by Glassnode, this score ranges from 0 to 1. A score near 1 means whales are actively accumulating (buying and holding). A score near 0 suggests distribution (selling). In Q3 2023, this score hit 0.87, signaling strong institutional interest despite market fears.
- Whale Reshuffling: This metric tracks short-term balance shifts among different whale subgroups over 30-day periods. It helps distinguish between one-off transfers and strategic repositioning of assets across multiple wallets.
For example, if you see the Exchange Inflow Mean spiking while the Accumulation Trend Score drops, you have a high-probability setup for a price correction. The whales are bringing ammo to the battlefield and getting ready to fire.
Real-World Impact: The Mt. Gox Case Study
Theoretical models are useful, but real-world events show the true danger. In July 2023, a wallet associated with the defunct Mt. Gox exchange woke up after 13 years of dormancy. It moved 300 BTC (worth approximately $33.47 million at the time) to Binance.
This was not a random transfer. These coins were originally purchased for roughly $11 each. Moving them to an exchange signaled potential repayment to creditors, which likely involved selling on the open market. The market reacted instantly. Traders watched closely, knowing that rapid withdrawals to multiple addresses would confirm a selling spree. This event highlighted a critical point: old debt becomes new supply. Dormant whales are the sleeping giants that can wake up and shake the floor out from under retail investors.
Another example is the Terra/LUNA collapse. Seven whales triggered a cascade that erased over $40 billion in value. Their coordinated exits created a liquidity vacuum. When everyone tries to exit through the same door at once, the price collapses to zero until someone is willing to buy the panic. Whales don't care about your entry price; they care about exit liquidity.
Tools for Monitoring On-Chain Data
You cannot rely on news headlines alone. By the time a whale move hits Twitter, the price has already adjusted. You need real-time tools. Several platforms have emerged to democratize this data:
- Lookonchain: Excellent for spotting specific wallet clusters and dormant address movements. They famously tracked the Mt. Gox transfers in real-time.
- Nansen: Focuses heavily on Ethereum and smart contract interactions. Nansen reported a 300% increase in whale monitoring tool usage in 2023, showing growing demand for this data.
- Santiment: Provides social sentiment combined with on-chain data, helping you see if whale moves are being discussed publicly before they impact price.
- Arkham Intelligence: Specializes in linking addresses to real-world entities, revealing that 12% of whale movements now cross multiple blockchain networks, making tracking more complex.
Setting up alerts for transactions exceeding $10 million is a standard practice for professional traders. It allows you to react to the splash before the wave hits your boat.

The Paradox of Market Signals
Here is the tricky part: identical actions can have opposite interpretations depending on the market cycle. During a bull run, large deposits might be seen as profit-taking. During a bear market, the same deposits might be viewed as capitulation-the final blowout before a bottom forms.
Glassnode’s September 2023 report suggested that accumulation patterns indicated an "anticipated market rally." Yet, CoinDesk’s January 2023 analysis argued that increased deposits represented "near-term profit taking." Who was right? Both, in their respective contexts. The difference lay in the broader macroeconomic environment and regulatory news regarding ETFs.
Furthermore, institutional whales behave differently than individual whales. BlackRock and other ETF applicants maintain steady exchange balances while accumulating through Over-The-Counter (OTC) desks. OTC trades happen off-exchange, so they do not show up as massive sell walls on the order book. This hides their true accumulation speed from casual observers. Retail traders looking only at exchange inflows might miss the fact that institutions are quietly buying billions in dollars of Bitcoin away from the public eye.
Liquidity Risks and Thin Order Books
Why do whale moves matter to you, the small investor? Because of liquidity. When whales store funds in cold wallets, the available supply on exchanges shrinks. This creates "thin order books."
In a thin market, even a moderate-sized trade can cause massive price swings. Bitcoin.tax documents that during low-liquidity periods, a $50 million trade can move the price by 5-7%. Imagine trying to sell $10,000 worth of Bitcoin in such a scenario. Your sell order might slip significantly, meaning you receive far less Bitcoin than the current spot price suggests. Whales exploit this slippage. They know they can dump large amounts with minimal impact if they break orders up, or they can trigger stop-losses en masse by pushing the price slightly below key support levels.
Future Trends: AI and Cross-Chain Tracking
The game is evolving. As of mid-2026, tracking is no longer just about Bitcoin and Ethereum. Layer 2 solutions and cross-chain bridges mean whales can hide their footprints by moving assets across multiple networks. Arkham Intelligence noted that cross-chain movements complicate traditional tracking methods.
To counter this, firms like Glassnode are integrating AI prediction models. Their Whale Behavior Prediction Algorithm combines deposit/withdrawal patterns with macroeconomic indicators to forecast price movements with 68% accuracy over 7-day windows. While not perfect, this represents a shift from reactive tracking to predictive analytics. The future of whale watching involves machine learning identifying subtle patterns that human analysts miss.
How much Bitcoin does it take to be considered a whale?
Generally, holding 1,000 or more Bitcoin qualifies an entity as a whale. For Ethereum, the threshold is typically 10,000 or more ETH. These thresholds are based on the ability to influence market price through significant trading volume.
Do whale deposits always mean they are going to sell?
Not always. While deposits often signal an intent to sell, they can also indicate preparation for staking, lending, or participation in DeFi protocols. Additionally, institutions may move funds for security upgrades or regulatory compliance. Context and accompanying metrics like the Accumulation Trend Score are vital for accurate interpretation.
What is the best tool for tracking crypto whales?
Popular tools include Lookonchain for real-time wallet tracking, Glassnode for deep on-chain metrics, and Nansen for Ethereum-specific smart contract activity. Santiment is also useful for combining on-chain data with social sentiment analysis.
Can whale movements be manipulated?
Yes. Some whales engage in "wash trading" or move funds between their own wallets to create false signals of accumulation or distribution. This is why relying on a single metric is dangerous. Analysts look for sustained trends over weeks rather than isolated daily spikes to filter out noise and manipulation.
How do whales affect market liquidity?
When whales withdraw funds to cold storage, exchange liquidity decreases, creating "thin order books." This makes the market more volatile, as smaller trades can cause larger price swings. Conversely, when whales deposit funds, liquidity increases, potentially stabilizing prices but increasing selling pressure.