Order Book Depth Analyzer
This interactive demonstrates how order book depth affects liquidity and price movement. Adjust parameters below to simulate different market conditions.
Bid Side
Ask Side
Deep market with strong liquidity on both sides.
Based on your current order book setup:
- Strong bid depth suggests buyers are actively accumulating at lower levels.
- Moderate ask depth implies sellers may not be aggressive.
- The narrow spread indicates low transaction costs and high liquidity.
- Large liquidity clusters can absorb significant trades without major price impact.
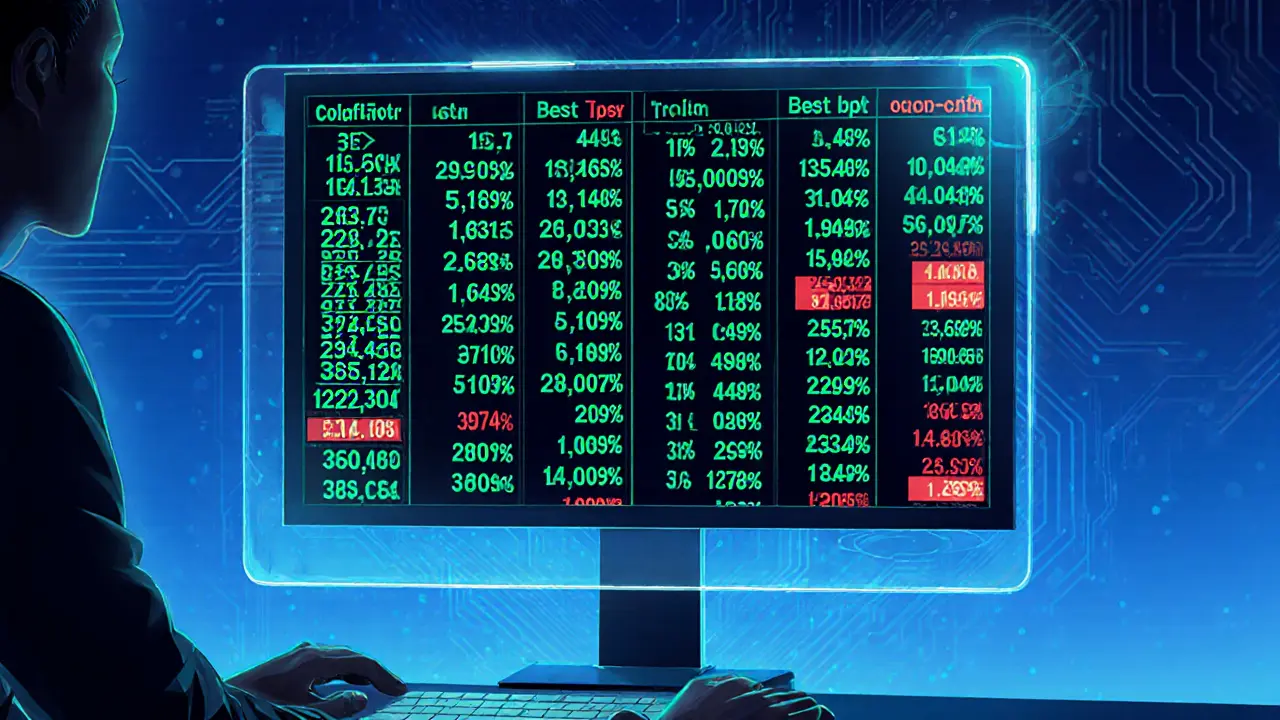
When you open a trading platform and see rows of numbers flashing in green and red, you’re looking at an Order Book. It’s a real‑time ledger that lists every pending buy and sell order for a given instrument. Understanding how that data works lets you read the market’s supply‑and‑demand pulse before a single trade actually hits the tape.
Key Takeaways
- The order book shows order book data for every price level, revealing hidden liquidity.
- Bid‑ask spread, market depth, and order flow are the three pillars of actionable analysis.
- Watch for manipulative tactics like spoofing and always cross‑check with trade history.
- Advanced traders combine heatmaps, AI, and cross‑exchange views for a holistic edge.
- Practice regularly; proficiency usually takes months of focused screen time.
What Exactly Is an Order Book?
An Order Book is essentially two sorted lists. The buy side-called Bid-lists prices from highest to lowest, because sellers want the best possible price. The sell side-known as Ask-orders prices from lowest to highest, since buyers prefer to pay less. The top of the bid list is the best bid, and the top of the ask list is the best ask. The gap between them is the Bid-Ask Spread, a direct liquidity indicator.
Peeling Back the Layers: Market Depth
Market Depth, often called Depth of Market (DOM), adds context beyond the best bid and ask. It aggregates the volume of orders at each price tier, letting you see where large piles of liquidity sit. A deep market-say, several thousand contracts clustered around a price-can absorb a big order without moving the price dramatically. Shallow depth signals that even modest trades could cause a price swing.
Reading the Flow: Order Flow Analysis
While market depth is a snapshot, Order Flow captures the dynamics-how bids and asks appear, disappear, or change size over time. Aggressive buying shows up as bids jumping up the ladder or large market orders eating through the ask side. Conversely, aggressive selling pushes the bid side down. By watching the rate of order‑book updates, you can infer momentum before price bars even form.
Executing Smartly: VWAP and Order Book
Large institutional traders often use VWAP (Volume‑Weighted Average Price) strategies that sit perfectly with order‑book data. Instead of dumping a huge block and moving the market, they slice the order and match it against the existing depth, aiming to fill at or better than the VWAP. The order book tells you exactly where the liquidity sits, so you can time each slice for minimal impact.
Spot the Tricks: Spoofing and Other Pitfalls
Not every order reflects genuine intent. Spoofing is a manipulative practice where a trader places a large order to lure others, then cancels it milliseconds later. The order book can flash a huge bid, prompting others to buy, only for the spoof to vanish and the price to reverse. To protect yourself, watch the order’s age, cancellation frequency, and whether the size suddenly disappears after a price move.

Tools of the Trade: Visualizing the Book
Most professional platforms present the order book in a tabular grid with cumulative totals. For example, if 780 contracts sit at $75.00 on the bid side and another 500 sit at $74.95, the cumulative column shows 1,280 contracts available at $74.95 or better. This visual cue helps you gauge how much you can trade without slippage.
Heatmaps take the tabular view a step further, coloring each price level based on liquidity intensity-bright green for heavy bid clusters, intense red for heavy ask clusters. Some platforms even offer 3‑D visualizations where depth becomes a surface you can rotate, making pattern recognition more intuitive.
From Human to Machine: AI‑Driven Order Book Analysis
High‑frequency trading firms feed order‑book updates into machine‑learning models that react in microseconds. These models spot micro‑patterns-like a sudden surge of tiny orders on the ask side-that are invisible to the human eye but predictive of short‑term price moves. While retail traders can’t match that speed, they can still use AI‑powered indicators that summarize order‑flow imbalances over a few seconds.
Comparing Order Book to Traditional Price Charts
| Aspect | Order Book | Price Chart |
|---|---|---|
| Data Type | Pending buy/sell orders | Executed trade prices |
| Liquidity Insight | Shows exact volume at each price level | Shows historical volume only |
| Real‑time Signal | Detects order flow, spoofing, imbalances | Lagging indicators (e.g., moving averages) |
| Complexity | Requires more screen time and practice | Easy for beginners |
Practical Steps to Start Using Order Book Data
- Open a platform that displays the full depth (at least 10 levels).
- Identify the best bid and best ask, then note the spread.
- Scan the cumulative column to see where large liquidity clusters sit.
- Watch the order flow for the last 30‑60 seconds. Are bids adding aggressively?
- Cross‑check with recent trade history to confirm whether the flow translates into price moves.
- Set alerts for when the spread widens beyond a threshold you consider normal for that instrument.
- Practice with small positions; gradually increase size as you become comfortable reading depth.
Common Mistakes and How to Avoid Them
- Overreacting to fleeting spikes. Orders can appear and disappear in milliseconds; focus on sustained changes.
- Ignoring order age. New orders are more likely to reflect true intent than stale ones.
- Relying solely on one side of the book. Balance insights from both bids and asks.
- Failing to account for market‑wide events. News can cause rapid order‑book churn that looks like manipulation.
- Not using cumulative totals. Looking at raw numbers can mislead you about actual available liquidity.
Next‑Level Strategies
Once you’re comfortable with basic depth reading, you can experiment with:
- Liquidity‑seeking algorithms that place limit orders just inside large clusters.
- Order‑book heatmap overlays combined with sentiment scores from social media.
- Cross‑exchange arbitrage by comparing the same asset’s books on multiple venues.
Future Outlook
Regulators are tightening rules around order‑book transparency, especially to curb spoofing. At the same time, AI and cloud‑based data pipelines are making micro‑second analysis accessible to more traders. Expect to see more integrated dashboards where order flow, price charts, and even Twitter sentiment flow together in a single view.

Frequently Asked Questions
What is the difference between a bid and an ask?
A bid is a pending buy order showing the highest price a buyer is willing to pay. An ask (or offer) is a pending sell order showing the lowest price a seller will accept. The best bid and best ask define the current market price range.
How can I spot spoofing in real time?
Look for large orders that appear on one side, stay for just a few seconds, and then vanish right before a price moves opposite to the order’s apparent intent. Frequent cancellations combined with sudden price reversals are red flags.
Why does a narrow bid‑ask spread matter?
A narrow spread indicates high liquidity, meaning you can enter or exit positions with minimal slippage. Wide spreads suggest low liquidity and higher transaction costs.
Can I use order‑book data for cryptocurrency trading?
Absolutely. Crypto exchanges provide order‑book feeds 24/7, and because many markets are less liquid than stocks, depth analysis can be even more valuable for timing large trades.
What tools help visualize the order book?
Most broker platforms include a depth grid and heatmap. Third‑party tools like BookMap or Sierra Chart offer advanced visualizations, including 3‑D depth surfaces and real‑time imbalances.
Mastering order‑book analysis isn’t a one‑day sprint-it’s a skill you build by watching, testing, and tweaking. Start small, keep a journal of what you see, and soon the green and red numbers will tell you a story you can trade on.


15 Responses
Order book analysis changed everything for me. I used to chase price action like a fool, but once I started watching the depth, I saw how most moves are just liquidity grabs. You don't need to predict the market-you just need to see where the real buyers and sellers are hiding. That heatmap trick? Game changer. I set alerts on clusters and wait for the breakout instead of chasing pumps. Took me 6 months to stop overtrading, but now I'm profitable on 7 out of 10 trades.
Start small. Watch one asset. Journal every false breakout. You'll thank yourself later.
This is so helpful!! 🙌 I’ve been staring at my DOM for weeks and felt so lost, but your breakdown made it click. I literally cried when I finally saw how the big bids were just masking a sell-off. Thank you for not making it sound like rocket science. I’m printing this out and taping it to my monitor 😊
Just started using BookMap last month. The 3D depth view is surreal. You can literally see the market breathing. I used to think order flow was voodoo, but now I see patterns-like how volume dries up before a reversal. Not magic. Just math. And patience. Don’t rush. Let the book speak.
Also, cross-checking with trade history saved me from three fake breakouts this week. Highly recommend.
Let’s be real-95% of retail traders are just gambling with order book visuals. You think you’re reading liquidity, but you’re just seeing what the algos want you to see. Spoofing isn’t a bug-it’s the system. The exchanges profit from your confusion. AI models don’t care about your ‘insights.’ They’re feeding you noise to suck in your margin. You’re not trading the book. You’re feeding it.
Stop chasing depth. Trade the macro. Or better yet-don’t trade at all.
Oh great. Another ‘order book guru’ telling people to trust the numbers. Meanwhile, the SEC just fined three exchanges for manipulating order flow data. You think the book is real? It’s a theater. The bids and asks? Actors. The ‘deep liquidity’? A mirage. You’re being played. The only thing you can trust is price action after the fact. Everything before that is a rigged game designed to make you feel smart while they take your money.
And yes-I’ve been doing this since 2010. I’ve seen it all. You’re not special. The book isn’t your friend.
Wow. Just… wow. You actually wrote a 2,000-word essay on ‘reading the book’ like it’s some sacred text. Did you also meditate on the spread before breakfast? Did you burn sage over your DOM? Did you name your best bid ‘Bobby’? I’m not joking. People actually believe this stuff. You’re not analyzing the market-you’re performing interpretive dance with a spreadsheet.
Price moves. That’s it. Everything else is noise dressed up as wisdom. Go trade your 100-share lot and stop pretending you’re Goldman Sachs.
I was skeptical too. But after watching the order book for 30 minutes a day for two months, I started noticing little things-like how the bid side gets quiet right before a big move. Not because I’m smart. Because I was patient. I didn’t trade until I saw the pattern repeat. Now I’m making consistent small wins. No need to go all-in. Just be consistent. And don’t stress when you miss a move. You’ll get another one.
Keep it simple. Watch. Wait. Act.
As someone who has traded across five continents and three regulatory regimes, I can confirm that order book literacy is not a luxury-it is a necessity in modern markets. The asymmetry of information between institutional participants and retail traders has never been more pronounced, yet the democratization of data access via platforms like BookMap, Sierra Chart, and even broker-integrated DOMs has created a rare window of opportunity.
However, one must not conflate visibility with insight. The aggregation of volume at price levels is merely the surface layer; the true signal emerges from temporal sequencing-how orders are placed, modified, and canceled in microsecond intervals. This requires not just observation, but disciplined pattern recognition over time.
Moreover, cross-exchange arbitrage is not merely about price differentials-it is about liquidity differentials. A thin book on Binance may look attractive, but if the same asset on Coinbase Pro shows 10x the depth, you are not arbitraging-you are chasing a trap.
Begin with one instrument. One exchange. One hour per day. Document everything. After six months, you will see the market not as a chart-but as a living ecosystem.
I’m a total newbie and this post made me feel like I can actually do this! I used to just look at candles and guess. Now I open my DOM and just watch for 10 minutes before trading. I don’t even place orders yet-just observe. Saw a big bid vanish yesterday and the price dropped 2% right after. Felt like a detective 😄
Thanks for keeping it real. No jargon overload. Just clear steps. I’m printing the checklist!
Bro. Order book is like reading a person’s body language. You see the tension in their hands, the way they shift weight before they speak. That’s what the bids and asks are doing. Big buyers don’t just dump-they whisper first. You gotta listen. I use heatmaps like a mood ring-green = calm, red = panic. And yeah, spoofing is everywhere, but if you wait 3 seconds after a spike, you’ll see who’s really holding the bag.
Also-crypto order books are wild. One minute it’s a tsunami, next minute it’s a puddle. Stay chill. Watch. Then move. 💪📈
really helpfull man. i try to read order book but its confuse me. now i understand what depth mean. i watch 10 min daily now. not trade yet. just watch. its like learning to swim before jumping in 😊
Seen this before. Doesn’t change anything. Price moves when it wants. Book just shows what’s already there. Watch the tape, not the list.
Let me guess-you’re telling people to trust the order book because you got rich off it. Newsflash: the same people who wrote this guide work for hedge funds that front-run retail traders. The ‘depth’ you see? It’s bait. The ‘liquidity clusters’? They’re honeypots. The AI tools? They’re designed to make you feel like you’re ahead when you’re actually being fed data optimized to trigger your emotional triggers.
They don’t want you to understand the book. They want you to obsess over it. So you trade more. So they make more off your commissions, slippage, and margin calls.
I used to believe this too. Then I stopped trading. And started watching. And realized the whole system is a pyramid built on self-delusion.
Don’t be the sucker who thinks they’ve cracked the code. You haven’t. They’ve already won.
While the technical framework presented here is sound, I’d like to emphasize the psychological dimension often overlooked. Order book analysis demands emotional regulation as much as cognitive skill. The temptation to act on fleeting liquidity signals is immense, especially when the market appears to confirm your hypothesis. Yet, the most successful traders I’ve mentored are those who wait for confluence-not just depth, but volume acceleration, time-of-day alignment, and macro context.
Also, remember that not all liquidity is equal. A 500-lot bid on a low-volume crypto pair is functionally meaningless compared to the same size on an S&P futures contract. Contextual weighting matters. Don’t treat all books the same.
And for beginners: journal your observations, not your trades. What did you see? What did you expect? What actually happened? The answer is in the reflection, not the P&L.
Oh, so now we’re all supposed to become quantitative analysts because someone wrote a blog? You think you’re smart because you know what VWAP stands for? Let me tell you something-real traders don’t need 3D heatmaps. They don’t need AI. They don’t need ‘cumulative totals.’ They have instinct. They have discipline. They have skin in the game.
And you? You’re just another retail zombie staring at a screen like it’s a crystal ball, hoping the green numbers will whisper secrets to you. Spoofing? AI? Cross-exchange arbitrage? That’s not analysis. That’s fantasy football for adults.
You’re not trading. You’re playing a video game where the house always wins. And you’re paying for the privilege.
Go touch grass. Then come back when you’ve lost everything.